

TSSI - expect procurement sales to be volatile but margins to go up
Gross versus net revenue (GAAP v. non-GAAP breakout), federal government demand impact, direction of margins

I was taking a look at Total Site’s last quarter and found I missed a useful aside from CFO Danny Chism on a new breakout in their last 10-Q:
Our segment reporting looks a little different this quarter than it did last quarter. Beginning in the third quarter, we're breaking out our Systems Integration and Facilities Management revenues in a bit more detail to increase the transparency and give investors a clearer picture of the drivers of our business. Particularly within the Systems Integration segment, we're providing a bit more detail to understand the portion of growth driven by the procurement activities versus systems integration activities. And in the MD&A section of the 10-Q filed earlier this afternoon, you'll find a tabular presentation of the procurement activities, in particular, in a bit more detail, not only the revenues, but cost of goods, gross profits, and gross margins for each of those components of the Systems Integration segment.
Here is what he is talking about - the table and commentary below does not appear in any previous quarterly filing.


In “gross deals”, the company adds value to an asset through labor and “transforming” it (the example I’m thinking of is modifying a server rack for data center use) and records value of procurement deals as the “value of transformed component” and COGs as the “value of component before transformation”. In “net deals”, the company just acts as a middleman between buyer and seller and collects a fee; the value of the deal is the fee and COGS (I believe) is the work to do the transaction.
The new tables the company is including make gross and net deals apples to apples (note this is a non-GAAP metric). Gross versus net matters for GAAP and more net transactions is going to make gross margin look better, whereas more gross will make deal size look better. See below how margins and deal size become much more similar using the non-GAAP, apples-to-apples measure by making net deals look at the value of the asset purchased:

This paragraph to me shows why they’re showing you this breakout:
Although the margins are thin, efforts required to support the business are minimal, so any incremental activity remains additive to our net income and can lead to additional cross-sales of higher yielding integration services, so we continue to view this business as a growth vehicle. As mentioned previously, the procurement business can fluctuate widely from quarter to quarter, and the recorded revenues can fluctuate even more widely if there is a substantial shift between gross and net deals, even if the underlying economics between the two are relatively similar.
I am generally pretty skeptical of any non-GAAP measure but I think this one makes sense. Without it, gross margins and procurement deal sizes would be all over the place quarter-to-quarter. Additionally, the company’s non-GAAP margins come in lower than GAAP, so they’re not trying to pull a fast one.
In addition to the last quarter including a much higher volume of gross deals versus net deals, the other big takeaway for me is that federal agencies / federal government budget was a big driver of last year’s results and Q3 and Q4 may look strong relative to others:
The procurement revenues increase, which was unusually large this quarter, was driven primarily by an increase in purchases from the federal government including several individually large sales, combined with a mix shift with a greater proportion of the revenues coming from gross deals, as opposed to net deals. While procurement revenues may remain at elevated levels for the next three to six months in comparison to historical trend, we do not currently expect them to be at quite this same level. As much of our procurement business is ultimately related to federal government buying, we believe this can contribute to some seasonality of these revenues. As the federal government budget ends on September 30 each year, we believe this may generally lead to an increase in procurement revenues in the quarter ending September 30 each year and again in the quarter ending December 31 as federal agencies receive their budgets for the new year.
I think the conclusion here is the government tailwind for procurement may be going away starting this year. So, while Q4 may look strong, I wouldn’t be surprised to see procurement take a major step back quarter-over-quarter in Q1 2025.
On the positive side, the company has suggested in transcripts and filings the 2025 sales pipeline was built in 2024 backlog and that some of the demand from Q3 is recurring. From the last call on a multi-year agreement with Dell:
The growth was driven by an increase in the AI-enabled rack integrations, which began late in the second quarter. Demand for this business is robust, and the recently signed multiyear agreement mentioned by Darryll to provide these services greatly reduces the effect of fluctuating demand or supply chain issues that are inherent in this business, allowing us to maintain the facility and staffing levels to quickly serve our customers' needs, enhancing our flexibility and ability to delight our customer.
They also wouldn’t have taken on debt to open a new factory that can 4x+ power generation from their previous one if they didn’t believe in the demand story.
Additionally, I also found this breakout interesting from the last 10-Q on Dell committing to a “certain minimum quantity of racks”. The below suggests Dell is guaranteeing demand and providing financing for growth:
To mitigate the impact of demand fluctuations and supply-chain issues on our growing AI-enabled rack integration business, our primary customer has committed to a certain minimum quantity of racks for which they will compensate us weekly, plus cover a portion of our fixed costs each month for us to maintain our facility and staffing at levels that can quickly provide integration services to them when they need it. With the recent signing of a multi-year agreement on essentially these same terms, we believe systems integration revenues for the quarter ended September 30, 2024, excluding procurement revenues, is more indicative of expected future systems integration revenues in the foreseeable future than are our year-to-date revenues, as we began integrating AI-enabled racks at this volume only in the month of June 2024. We believe this structure reduces our downside risks and allows us to effectively maintain a workforce that can complete integration services quickly to delight our customers with rapid turnarounds.
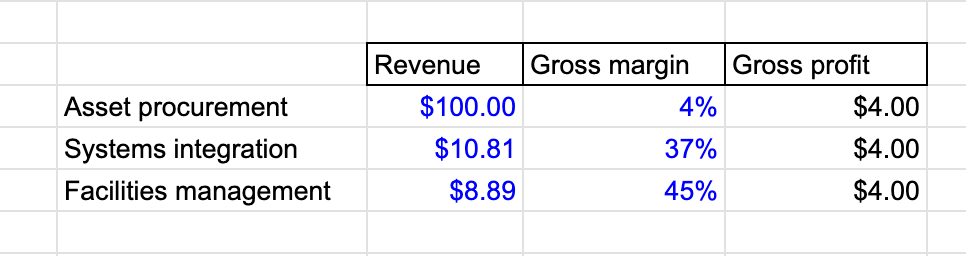
That said, the callout specifically excludes procurement revenue, which for last quarter was 85%+ of total revenue. However, as system integration revenue is 11x+ higher margin (45% versus 4%), it may be the case we see higher for longer growth in margins versus sales. You can see below to reach the same amount of gross profit, asset procurement needs $100m versus $11 for SI and $9 for facilities management.
The bull case I believe here is more sales will eventually drift to the higher margin businesses. Total Site has been consistent in saying procurement sales lead to cross-sales in the other two, which also can be recurring.
I went back and looked at previous quarterly results for Total Site and Dell’s Infrastructure Solutions Group (ISG). You can see from the below there isn’t a strong correlation and Total Site’s results jump around a lot (note the yellow cell is my wet-finger-in-the-air prediction). This makes sense in the context of procurement revenue being so volatile, especially now that we know gross versus net deals can impact the total number so much:

Some of the volatility here I am thinking also is a result of orders for data center equipment not being perfectly spaced out as requirements are in flux. On the Q2 call, CEO Darryll Dewan makes this point specifically on server racks:
Just recently, a single rack would typically consume 10 to 15 kilowatts of power. Today's AI racks push 80 kilowatts and we anticipate soon reaching 120 to 150 kilowatts in the next couple of generations. Industry road maps project over 200 kilowatts within a couple of years. This is an incredible growth in power density in a remarkable short period of time. This swift advancement is causing uncertainty for data center equipment buyers and may cause some lumpiness in our growth trajectory.
Overall, I think on a GAAP basis we are going to continue to see Total Site’s revenue show no consistency and the non-GAAP measure will be helpful going forward. I think margins will be more important to look at as the key to the story is procurement revenue can translate into systems integrations and facilities management revenue (which again can be 10-11x+ as large on gross margins). Overall, revenue volatility should be expected for Total Site and I expect given the lack of coverage we might see huge volatility in the stock price for those not as familiar with the story and accounting. Over time, my north star metrics are the growth in Systems Integration and Facilities Management.